Account Login
Don't have an account? Create One

The interpretation assigned to the significance and the seriousness of Newfoundland and Labrador’s fiscal problem is, to a large extent, subjective and often simply descriptive.
This, in spite of the fact that objective fiscal data exists for all provinces over significant periods as well as criteria—sustainability, flexibility and vulnerability—with quantitative indicators (i.e. net debt per capita, net debt as a percent of total revenue and the share of provincial revenues derived from the federal government). However, there are no commonly agreed upon standards applied to each indicator to demonstrate when a province exceeds a fiscal threshold. Additionally, there are no universally agreed upon weights attached to each indicator even though different indicators and standards yield different interpretations of the significance and seriousness of the fiscal problem analyzed.
Depending upon the subjective weights attached to the quantitative fiscal data and the timeframe chosen, different interpretations will prevail as to whether Newfoundland and Labrador has a fiscal problem, a crisis or no problem at all. As demonstrated below, for the period 2011-12 to 2021-22, the province has teetered between a serious fiscal problem and a fiscal crisis. Furthermore, its fiscal sustainability, flexibility and vulnerability is the worst of the 10 provinces.[1]
Newfoundland and Labrador expenditure and revenue profiles
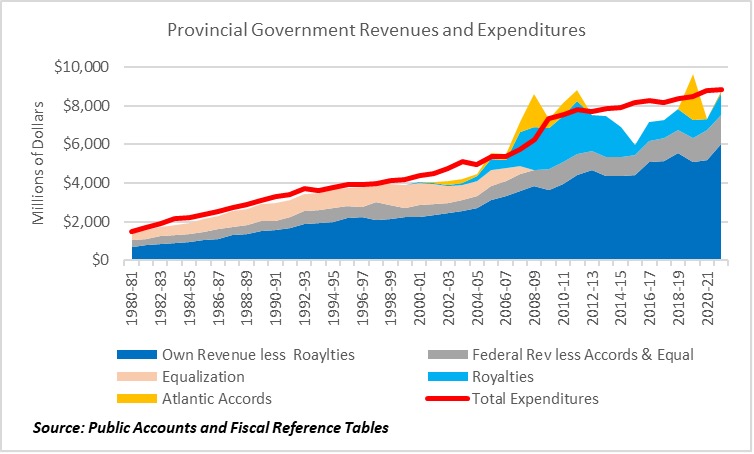
Figure 1 illustrates that Newfoundland and Labrador generated only eight fiscal surpluses since 1980-81, totaling $7.0 billion. On the other hand, since 2012-13, the province incurred nine fiscal deficits totaling $8.2 billion. Interestingly, net transfers associated with the 1985, 2005 and 2019 Atlantic Accords equaled $7.3 billion, $0.3 billion more than the eight surpluses combined. From 1980-81 to 2021-22, Newfoundland and Labrador incurred $8.0 billion more in fiscal deficits ($15 billion) than it generated in fiscal surpluses ($7.0 billion). As well, cumulative oil royalties summed to $24.6 billion, averaging 12% of provincial revenues per annum over the period 1980-81 to 2021-22 and peaking at 31.7% of provincial revenues in 2011-12. Likewise, the federal government transferred $205 billion to the Newfoundland and Labrador treasury over this period, averaging 30.1% of provincial revenues and peaking at 50.7% in 1984-85. During this period, the province received $22.6 billion in equalization payments, which averaged 11% of provincial revenues and peaked at 31.7% of the annual revenues received in 1987-88 by the Newfoundland and Labrador treasury.
“From 1980-81 to 2021-22, Newfoundland and Labrador incurred $8.0 billion more in fiscal deficits ($15 billion) than it generated in fiscal surpluses ($7.0 billion).”
The province had good luck in terms of favourable conditions for oil royalties and good fortune in terms of receiving Atlantic Accord revenues from Government of Canada. As a result, the provincial treasury projected positive fiscal management by generating six fiscal surpluses from 2005-06 to 2011-12. Unfortunately, the provincial government failed to control its spending, even in years of significant revenue collapse. This failure to reign in expenditure resulted in the province’s net debt increasing faster than all other provinces. This caused all the fiscal indicators to turn more negative than otherwise would have been the case. This, in turn, has led to the observation that the province is in full-blown fiscal crisis.
Fiscal problems versus fiscal crises: let me tell you a story
There are three distinct narratives that apply to Newfoundland and Labrador’s finances:
Politicians, in the first scenario, have lost control. After protracted fiscal problems, the province in currently experiencing a full-blown crisis, which requires immediate and drastic actions to stave off provincial bankruptcy. The province needs to reimagine its fiscal approach so as to avoid floundering in the sea of financial uncertainty. Failing to implement major policy changes would imply that the province and its leaders have acquiesced to their fate, leaving financial opportunists to snatch up provincial assets at bargain basement prices while politicians dither, pondering what to do next. Failure to act would transform Newfoundland and Labrador from a province into a territory, effectively forfeiting its financial independence. Essentially, the province would be destined to relive its 1930s Commission of Government experiences when the approval of nonelected officials was needed in financial matters. There was no role for elected representatives in implementing policies that were in the public interest.
“Essentially, the province would be destined to relive its 1930s Commission of Government experiences when the approval of nonelected officials was needed in financial matters.”
According to the second narrative, the province has been the victim of consecutive misfortunes which have evolved into longer-term, fiscal problems. However, Newfoundland and Labrador will not have bad luck in perpetuity. Things will eventually improve even though a problem exists currently. This problem necessitates the jettisoning of bad fiscal policies and self-perpetuating, politics-as-usual leadership. Through the implementation of good managerial decisions, the fiscal ship can be righted.
The second scenario is optimistic. It implicitly assumes a leadership committed to effective fiscal management. In addition, it involves leaders choosing not to “kick the can down the road,” no matter how politically convenient. It requires further that leaders deal with the fiscal problem in an open and transparent way. There is no need for grandiloquent leaders who obfuscate significant issues and avoid appropriate policies through feel-good boosterism, detached from relativity. Words are simply not enough—real actions are needed.
The third storyline posits the province is the epitome of fiscal prudence, reflecting sustainable, stable and resilient fiscal policies where strong political leaders lead! Leaders guide the province through the perils of debt, deficits, health problems, educational concerns, excessive unemployment and an aging population. In this scenario, Newfoundland and Labrador has a growing economy, which provides jobs for all, consistently reports balanced budgets, carries debt sufficient to fund productive public infrastructure at appropriate levels, is characterized by a healthy, educated population, is an attractive place to live and raise a family and induces sufficient interprovincial and international migration to have a growing population.
Obviously, this third scenario is more aspirational than real. The province is not there yet, but hope, tempered with reality, is an important attribute of any economy. Without a vision of where to go, aspirational or otherwise, the Province may never get there and it may never try which is unfortunate since even the longest journey starts with one foot in front of the other.
“The third storyline posits the province is the epitome of fiscal prudence, reflecting sustainable, stable and resilient fiscal policies where strong political leaders lead! /Obviously, this third scenario is more aspirational than real.”
In reading analyses of the province’s fiscal situation, it is important to realize that effective communication specialists can make all three narratives seem real and achievable. Moreover, one’s perception of reality often depends upon one’s fiscal ideology. Equally important to one’s perception of the fiscal situation is the time period encompassed by the narrative. Perception will be shaped by whether the focus is on the here and now, the next five to 10 years, or the longer run, which extends beyond ten years, is beyond the forecasting abilities of most crystal balls and would extend right into the realm of speculation and guessing, the forte of the dismal science.
Fiscal problems versus fiscal crises – How can we tell?
Objective fiscal criteria are sustainability, flexibility and vulnerability. These criteria indicate the presence of a fiscal problem and distinguish a problem from a crisis. Sustainability measures whether the government is living beyond its means. This occurs when a government cannot meet its financial obligations without resorting to increased debt. The indicators typically utilized for this criterion are the levels and changes in annual budget deficits (surpluses), annual budget deficits (surpluses) as a percentage of GDP, net debt, net debt per capita and net debt as a percentage of GDP. Flexibility reflects the ease with which a government can meet any elevated commitments through an increase in revenue or an expansion of debt. An indicator of flexibility is debt costs expressed as a percent of total revenues. The rationale for this indicator is that since satisfying debt expenses is mandatory, the larger this percentage, the less able is the government to raise revenues or borrow additional funds to implement innovative programs and services. Vulnerability measures how diversified is the government’s revenue sources. That is, the proportion of funding outside of its control, such as federal government sources or, in Newfoundland and Labrador’s case, offshore oil royalties.
“(The) analysis of these criteria are necessarily descriptive or quasi-quantitative. Subjectivity can lead to different interpretations: a fiscal problem for one analyst may be a fiscal crisis for another.”
Unfortunately, the indicators’ thresholds are typically undefined and vague. Consequently, the interpretation of what constitutes a local fiscal crisis is effectively a subjective estimate. As a result, the analysis of these criteria are necessarily descriptive or quasi-quantitative. Subjectivity can lead to different interpretations: a fiscal problem for one analyst may be a fiscal crisis for another. In other words, any individual observing any set of fiscal actions may perceive them as indicating a fiscal problem requiring better management, may interpret them as a fiscal crisis where the jurisdiction is on the edge of a fiscal cliff or may see them reflecting of a government that demonstrates foresight, responsibility and fiscal perspicuity so that everything is copacetic.
Given these caveats, it is insightful to examine relevant, publicly available, fiscal data. This is done below for the period 2011-12 to 2020-21 and for the period 2022-23 to 2031-32.
Newfoundland and Labrador net debt in 2021-22: from bewilderment to confusion
In 2021-22, Newfoundland and Labrador had a consolidated net debt of $16.4 billion, comprised of $12.1 billion in assets minus $28.5 billion in liabilities. Liabilities consist of $17.2 billion in net borrowings.[2] The outstanding balance on a 30-year promissory note covering the outstanding balance of the unfunded liability which had accrued prior to the governance restructuring of both the Public Sector and the Teachers’ Pension Plans is added to net debt. This promissory note requires annual payments of $330 million and accounts currently for $4 billion in net debt. An unfunded pension liability of $580 million, an unfunded liability associated with group health and life insurance retirement benefits of $3.5 billion, and another $1.1 billion is owed to the Government of Canada as payables and accrued liabilities, other payables and accrued liabilities of $1.9 billion and $474 million in deferred revenue are all added to net debt.
The Province’s financial assets consist of $1.6 billion in cash and temporary investments, $0.4 billion in loans, advances and investments, $3.5 billion in receivables (including $2.7 billion under the 2019 Atlantic Accord) and $6.6 billion in equity from Government Business Enterprises and Partnerships. The issue of how to count NALCOR equity is more complicated and is discussed below under rate mitigation.
Cumulative deficits per capita: unsustainability and debt addiction
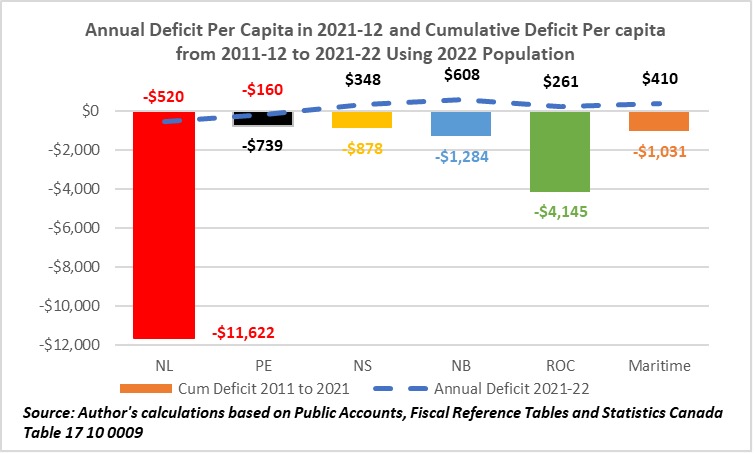
Newfoundland and Labrador, as shown in Figure 2, ran a cumulative deficit per capita equal to $11,622 over the period 2011-12/2021-22. This was larger than all other provinces except Alberta ($13,220). The corresponding estimate for the rest of Canada was $4,145 and the per capita deficit in the Maritime provinces equaled $1,031. It is worth noting that the Province’s cumulative deficit during this time period stood out, not in a good way, from other jurisdictions. Newfoundland and Labrador, Prince Edward Island, Manitoba and Saskatchewan continued to run annual deficits, albeit smaller than in the most recent periods. Although running smaller deficits or even balanced budgets is a good fiscal indicator, it does not eliminate or reduce a province’s fiscal problem. To reduce the debt problem (crisis), consistent surpluses need to be generated and applied to outstanding net debt. Specifically, with a 3.5% interest rate and payments over a 30-year period, surpluses of $430 million per annum for the next 30 years would be needed to bring Newfoundland and Labrador’s per capita debt down to $16,179, which is the current average in the Maritime provinces. A daunting task!
“Surpluses of $430 million per annum for the next 30 years would be needed to bring Newfoundland and Labrador’s per capita debt down to $16,179, which is the current average in the Maritime provinces.”
The presence of persistent deficits shows that Newfoundland and Labrador has been spending significantly more than it has taken in revenue. This is true in absolute terms and relative to other provinces, indicating that Newfoundland and Labrador is the least fiscally responsible province. Furthermore, since this money was borrowed and provincial borrowing has been increasing in the last decade, the situation does not appear to be sustainable. Newfoundland and Labrador has a fiscal problem that is more severe than other provinces. Despite recent improvements, the current situation could and should be considered a serious fiscal problem that is a precursor to a fiscal crisis.
Net debt per capita: problem or crisis?
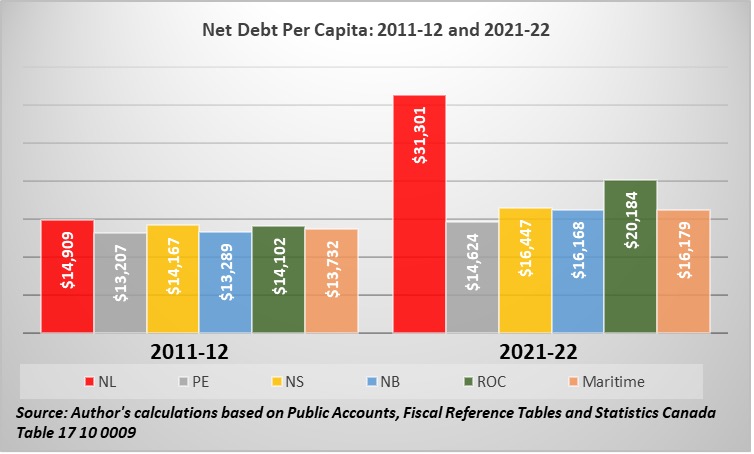
From 2011-12 to 2021-22, with the exception of 2012-13 and 2013-14 for both Quebec and Ontario, net debt per capita and its cumulative growth rate in Newfoundland and Labrador exceeded all other provinces. Specifically, net debt per capita in Newfoundland and Labrador grew by 110% (from $14,909 to $31,301). The corresponding figures for the other provinces were 11% in Prince Edward Island (from $13,207 to $14,624), 16% in Nova Scotia (from $14,167 to $16,168), 22% in New Brunswick (from $13,289 to $16,168), 18% in the Maritime provinces (from $13,732 to $16,179) and 43% in the rest of Canada (from $14,102 to $20,184). Figure 3 illustrates that Newfoundland and Labrador has the largest net debt per capita in both 2011-12 and 2021-22 and it has grown over the two periods.
Additionally, net debt as a percentage of GDP in 2020-21, was 34% in both the Maritime provinces and the rest of Canada, while Newfoundland and Labrador’s net debt was 48.5% percent of GDP. Between 2011-12 and 2020-21, net debt as a percent of GDP in Newfoundland and Labrador increased by 25 percentage points (from 24% in 2011-12 to 49% in 2020-21). With $31,300 in net debt per capita and net debt approximately equal to 50% of its GDP in 2020-21, Newfoundland and Labrador has a fiscal problem that is larger than any other province within Canada. This problem has been growing and it may even have reached crisis proportions.
Revenue and expenditure: sufficient revenue, but excessive spending
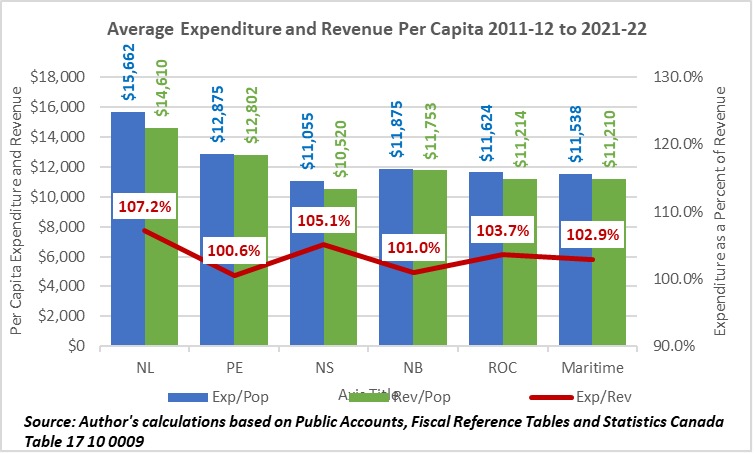
With two exceptions (Prince Edward Island in 2015-16 and Quebec in 2020-21), Newfoundland and Labrador’s total revenue per capita exceeded that of all provinces from 2011-12 to 2021-22. During this period, Newfoundland and Labrador’s total revenue per capita decreased by 2%, while it increased by 37% and 41% in the Maritime provinces and in the rest of Canada, respectively. Despite having the lowest growth in revenue per capita, Newfoundland and Labrador reported a per capita revenue in 2011-12 of $16,763. In 2021-22, its per capita revenue was $16,434, exceeding per capita revenue reported in all other provinces.
Newfoundland and Labrador’s total expenditure per capita surpassed that in all provinces from 2011-12 to 2021-22. Over this period, Newfoundland and Labrador’s total expenditure per capita increased by 14%. The corresponding increases for the other provinces were: 29% for the Maritime provinces and 31% in the rest of Canada. The growth rate in total expenditure per capita in Newfoundland and Labrador was the lowest of all provinces. In 2011-12, with $14,910 per capita, Newfoundland and Labrador still outspent all other provinces. Despite its lower growth rate, the province’s per capita total expenditure, with $16,954 in 2021-22, still surpassed all other provinces.
Figure 4 illustrates that Newfoundland and Labrador had both higher average per capita revenue and expenditure than each of the Maritime provinces and the rest of Canada. Interestingly, Newfoundland and Labrador’s average per capita expenditure ($15,662) exceeded its average revenue ($14,610) by 7.2%. Other than Quebec and British Columbia, all other provinces had expenditure exceeding revenue but by a smaller amount than observed in Newfoundland and Labrador. Given average total expenditure per capita exceeding all other provinces, Newfoundland and Labrador appears to have an expenditure problem.
Debt charges per capita – An indication of a debt problem
Newfoundland and Labrador’s debt charges per capita exceeded debt charges per capita in all provinces from 2011-12 to 2021-22. Over this period, Newfoundland and Labrador’s debt charges per capita increased by 20% (from $1,502 in 2011-12 to $1,800 in 2021-22), while debt charges per capita decreased by 3%, 26%, 9% and 18% in Prince Edward Island, Nova Scotia, New Brunswick, and the Maritime provinces, respectively. They increased by 2% in the rest of Canada. The 20% increase in Newfoundland and Labrador’s debt charges per capita occurred even though the yield on long-term government bonds fell by 50% (from 3.66% in March 2011 to 2.45% in March 2022). Given that in the last two years, the yield on long-term Government of Canada bonds has tripled, increasing from 0.99% in September 2020 to 3.03 in September 2022, current and near-term borrowing will be undertaken in an increasing-interest rate environment.
Debt charges as a percent of total revenue: increasing inflexibility
In 2021 -22, Newfoundland Labrador had debt charges that were equivalent to 11% of its revenue. This was higher than any province in Canada in 2021-22. Except for Alberta, Newfoundland and Labrador was the only province to see an increase in this ratio between 2011-12 and 2021-22. With a ratio that is already the highest in Canada and increasing faster than other provinces, its fiscal flexibility is more constrained than other provinces.
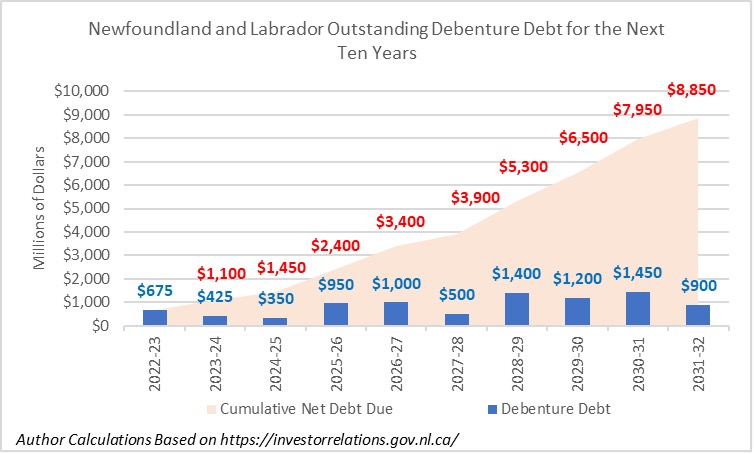
Rolling over debt without a public plan: not a good recipe/not good management
As shown in Figure 5, the province has $8.9 billion in debenture debt maturing in the next 10 years. Moreover, there is no publicly available plan pertaining to how the Government of Newfoundland and Labrador will deal with this. It is a legitimate question to ask: where will the province find nearly one billion dollars per year for each of the next 10 year to retire this debt? Without a public plan for debt retirement, it appears this net debt will be simply rolled over. Newfoundland and Labrador will have to borrow this money in an environment of increasing interest rates. This would exacerbate debt servicing costs, further compounding the fiscal problem/crisis.
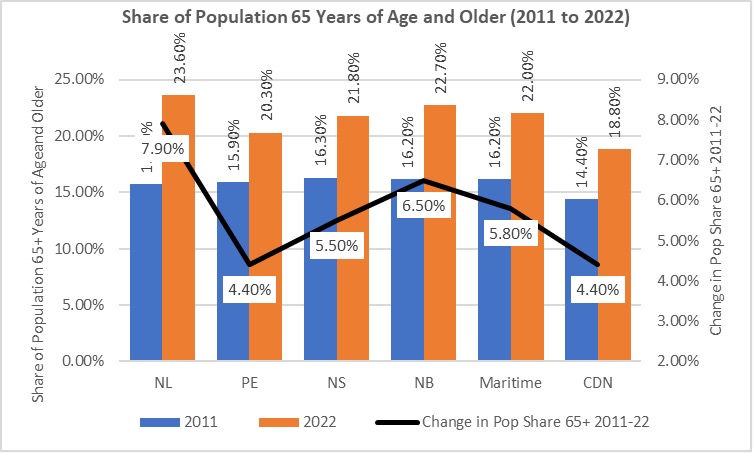
An aging population: Newfoundlanders and Labradorians are getting older and it makes a difference
Figure 6 indicates that Newfoundland and Labrador’s population is getting older and getting older faster than any other province. Note, an aging population requires more health care expenditures per capita and the revenue raised by government falls off dramatically once a taxpayer reaches 65 years of age. Both of these factors tend to make it more difficult to deal with Newfoundland and Labrador’s fiscal problem/crisis.
Royalty carry backs: increased net debt in the future
Offshore oil projects must be decommissioned at the end of their productive lives. Commissioning requires that a plan be submitted to government for approval. Once approved, any net decommission costs incurred can be utilized to offset royalties already paid by the project. Consequently, carried back net decommissioning costs will constitute a payable for the provincial government or a liability not yet reflected in the Public Accounts of the province.
The size of these royalty carry backs are currently unknown because none of the four offshore projects has been decommissioned. However, these carry back provisions will require the provincial government to return to the operators hundreds of millions of dollars in royalties.[3] In recent agreements to ensure that the Terra Nova project and the White Rose extension project continue operations, the Government of Newfoundland and Labrador revised their royalty agreement on both projects. As part of these revisions, the provincial government can utilize a $200 million credit against the royalty implications associated with decommissioning costs. While this $200 million credit will mitigate against the full brunt of decommissioning, the royalty carry back provisions, when they become effective, will increase the provinces net debt, which, in turn, will compound further Newfoundland and Labrador’s fiscal problem/crisis.
“The size of these royalty carry backs are currently unknown because none of the four offshore projects has been decommissioned. However, these carry back provisions will require the provincial government to return to the operators hundreds of millions of dollars in royalties.”
Rate mitigation: what happens to the asset value of Nalcor and provincial net debt?
Whether the assets recorded for Nalcor in 2021-22 are worth $19.6 billion is an open question. If there is insufficient revenue generated by Muskrat Falls electricity, then the value of Nalcor assets will be written down. If there is an asset impairment, then the $6.6 billion equity value reported for Government Business Enterprises and Partnerships will fall. This, in turn, will cause the net debt reported by the province to increase.
Unfortunately, the $5.2 billion rate mitigation agreement between the Government of Canada and the Government of Newfoundland and Labrador may not be sufficient to offset the possibility of asset impairment. Although it is straight forward how the $1 billion investment in the projects’ Labrador-Island Link and a federal loan guarantee of $1 billion for the Projects’ Muskrat Falls and Labrador Transmission Assets would constrain electricity prices, it is less clear how the transfers to the province of the $3.2 billion associated with the federal government’s net profit interest in Hibernia will work. Specifically, the mechanics of the transfer from the Government of Newfoundland and Labrador to the Government Business Enterprises and Partnerships are not clear. Is this transfer a subsidy? An additional equity purchase? Or will it involve direct payments to ratepayers? If this $3.2 billion is transferred from the provincial government to Nalcor as equity, then that does not solve the problem of keeping the price of electricity lower. If it goes as a subsidy to the Government Business Enterprises and Partnerships, then this opens up issues around the North American Free Trade Agreement and Federal Energy Regulatory Commission. It is not clear where that goes. It is just another element of uncertainty pertaining to Newfoundland and Labrador’s fiscal position.
“If this $3.2 billion is transferred from the provincial government to Nalcor as equity, then that does not solve the problem of keeping the price of electricity lower.”
Finally, the Muskrat Falls project and the Hibernia project have different years of asset life remaining. As well, public information on the rate mitigation plan does not enable one to calculate whether the money from the net profit interest is sufficient to prevent asset impairment. If these two cash flows do not match in present value terms, then either electricity prices will be higher than currently envisioned or the assets will be written down and the province’s net debt will increase.
Conclusion
Newfoundland and Labrador has had a trajectory of fiscal problems that mirror a fiscal crisis. This situation has developed despite the fact that Newfoundland and Labrador has received more revenue per capita than any other province. However, it has had less control on its spending and correspondingly exhibits less discipline in its propensity to borrow. Although the province has significant fiscal problems, these have been manifested in spite of the fact that Newfoundland and Labrador has had sufficient help from the federal government. It should be highlighted that the additional debt incurred by the province had enabled employment levels to be higher than otherwise within the province.
Without real political leadership, a difficult fiscal problem has morphed into a fiscal crisis, exacerbated by:
[1] Fuss and Elder, (2022), “Measuring the Fiscal Performance of Canada’s Premiers, 2022”, Fraser Research Bulletin, November 2022 recently rank Premier Fury’s fiscal performance last of all Premiers with a score of 40 out of 100.
[2] Borrowings associated with Government Business Enterprises and Partnerships are not directly reflected in net debt figures. They, instead, are recorded through Government Business Enterprises and Partnerships equity ($6.6 billion in 2021-22). This equity is considered a financial asset and is deducted from other provincial liabilities to yield the net debt estimate reported in the Public Accounts. Specifically, the asset values for the Government Business Enterprises and Partnerships are $19.6 billion and the liabilities are $13.0 billion resulting in $6.6 billion in equity.
[3] In Annual Report of the Office of the Auditor General, January 2022, p.8, the Auditor General recently suggested that “Government should determine the impact, if any, that the carry back of expected decommissioning costs will have on offshore royalties and ensure that these costs are accounted for in the Public Accounts in accordance with Canadian Public Sector Accounting Standards.”
Comment policy
Comments are moderated to ensure thoughtful and respectful conversations. First and last names will appear with each submission; anonymous comments and pseudonyms will not be permitted.
By submitting a comment, you accept that Atlantic Business Magazine has the right to reproduce and publish that comment in whole or in part, in any manner it chooses. Publication of a comment does not constitute endorsement of that comment. We reserve the right to close comments at any time.
Cancel
Very good content. A challenge for all of us that do business across Atlantic incl. NL.
Oh my, it will take a lot of courage to deal with this impending financial disaster and I don’t see any politician or Party willing to take on that challenge!!
Unfortunately, the well will have to go completely dry before they admit to the extent of the problem!!!